
QR codes are everywhere, but tracking their performance is key to making them work for your business. Here’s how you can monitor and optimize QR code campaigns effectively:
- Set Up Tracking Parameters: Use UTM parameters or dynamic QR codes to gather data like scan location, device type, and time of engagement.
- Choose the Right Tools: Pick analytics tools with features like real-time tracking, geographic data, and campaign grouping.
- Focus on Key Metrics: Monitor scan rates, unique scans, conversion rates, and bounce rates to measure success.
- Analyze Trends: Use geographic and time-based data to identify when and where users interact with your QR codes.
- Optimize Campaigns: Adjust QR code placement, design, and landing pages based on analytics to improve performance.
Why It Matters: QR code tracking helps you understand user behavior, refine your campaigns, and increase ROI. For example, businesses using dynamic QR codes report up to 3-4x higher engagement and save costs by updating links without reprinting materials.
Quick Tip: Tools like Pageloot make it easy to track, analyze, and improve your QR code campaigns with features like real-time data, A/B testing, and detailed dashboards.
Ready to make your QR codes work harder? Let’s dive into the details.
QR Code Tracking: Analyze The Performance Of Your Campaigns
Step 1: Set Up Tracking Parameters for QR Codes
Before launching your QR campaign, it’s essential to establish tracking parameters that will let you gather key interaction data. This first step ensures you capture detailed insights into how people engage with your QR codes.
Tracking QR code performance typically involves two approaches: UTM parameters and dynamic QR codes. Together, these methods provide a reliable way to collect and analyze data.
Using UTM Parameters for Campaign Tracking
UTM parameters are small bits of text added to the end of URLs (using ? for the first parameter and & for additional ones) that help track campaign performance through analytics tools like Google Analytics. For instance, instead of using a plain URL such as:
https://www.yourstore.com/sale
you can create a tracked version like this:
https://www.yourstore.com/sale?utm_source=billboard&utm_medium=print&utm_campaign=summer_sale&utm_content=image1&utm_term=locationA
This enhanced URL lets you pinpoint which specific placement or medium drove traffic to your website. The five standard UTM parameters are:
- Source: Identifies where the traffic originated (e.g., billboard, flyer, poster).
- Medium: Specifies the marketing channel (e.g., print, digital, outdoor).
- Campaign: Refers to the campaign name (e.g., summer_sale, grand_opening).
- Content: Tracks variations of the same ad (e.g., image1, version_a).
- Term: Captures keywords or location details (e.g., locationA, downtown).
Businesses that use QR codes with UTM tracking report around 30% higher engagement rates with their campaigns. However, consistency is critical – using "Facebook" in one campaign and "facebook" in another can fragment your data in analytics. For campaigns that require real-time adjustments, dynamic QR codes offer a more flexible solution.
Dynamic QR Codes for Flexible Tracking
![]()
Dynamic QR codes bring advanced tracking features and allow you to update the destination URL even after the code has been printed. This flexibility is perfect for making real-time changes to your campaign. These codes use a redirect URL that can be modified at any time, meaning you can fix broken links or update offers without the need to reprint materials.
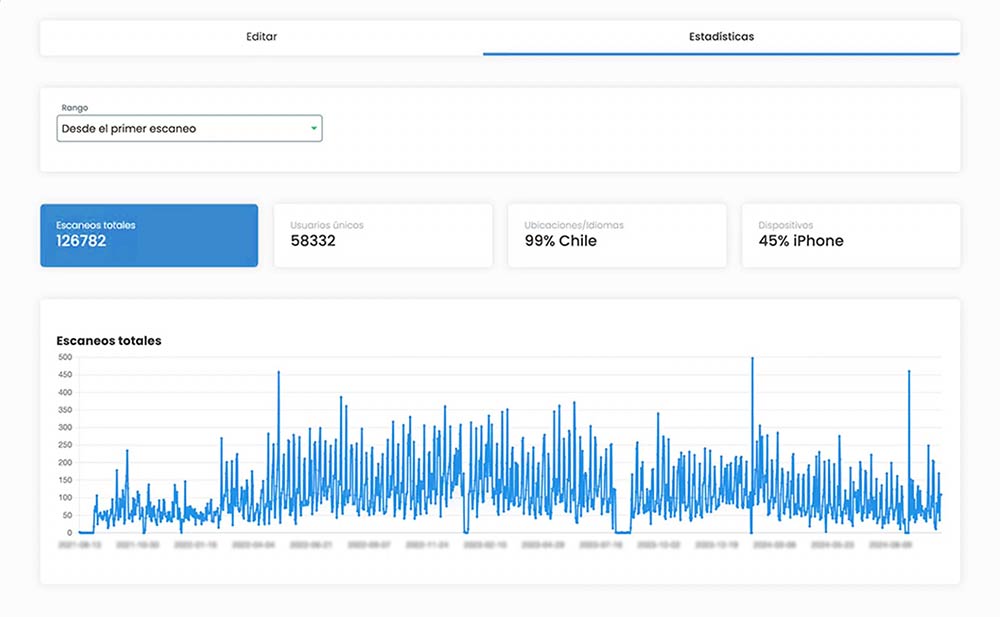
Dynamic QR codes also collect valuable metrics such as scan location, device type, browser, operating system, and timestamps. For example, in 2022, Hong Kong’s M+ museum used dynamic QR codes to generate over 148,000 visitor engagements and 113,000 unique interactions. Similarly, Marriott Aruba replaced all restaurant menus with dynamic QR codes in 2020, saving around $150,000 in printing costs while connecting with over 80,000 customers.
Dynamic QR codes tend to deliver 3–4 times higher engagement. Additionally, 95% of businesses report that QR codes help them gather vital first-party data, and 62% of surveyed companies expect increased sales by 2025 due to QR-driven initiatives.
"Unlike traditional fixed codes that lead to unchangeable destinations, dynamic QR codes allow marketers to update linked content without replacing physical materials, track scanning metrics, and personalize experiences based on scanning location, time, or user history."
Getting started is simple. Use a QR code generator to create your dynamic code, customize it with your brand colors and logo, include a clear call-to-action, and thoroughly test it before launching.
For short-term promotions, static UTM-tracked codes work well. For longer-term or adjustable campaigns, dynamic QR codes are the better choice.
Step 2: Choose the Right QR Code Analytics Tool
Picking the right QR code analytics tool is a game-changer. It’s the difference between guessing how your campaign is doing and having solid data to guide your decisions. With 51% of businesses prioritizing advanced analytics in their QR platforms, it’s clear that detailed insights into user behavior are essential for optimizing campaigns.
Key Features to Look For in an Analytics Tool
When evaluating QR code analytics tools, focus on features that go beyond just counting scans. You’ll want tools that give you actionable insights:
- Real-time analytics: See when and where scans occur, along with details like the user’s operating system. This helps you adjust campaigns on the fly and perfect your timing.
- Total and unique scans: Total scans show overall engagement, while unique scans reveal how many individual users interacted with your QR codes. This is crucial for understanding your campaign’s true reach and calculating conversion rates.
- Geographic tracking: Find out exactly where your QR codes are being scanned. This helps you make smarter decisions about placement and targeting.
- Device and operating system tracking: Learn whether users are scanning with iOS, Android, or other devices. This data ensures your landing pages are optimized for the most popular platforms.
If you’re debating between free and paid tools, the differences in tracking capabilities are significant:
| Tracking Feature | Paid Analytics Tools | Free Tools |
|---|---|---|
| Location Tracking (GPS) | ✅ Exact location data | ❌ Not available |
| Real-Time Tracking | ✅ Live updates | ❌ No live updates |
| Device Tracking | ✅ Device type insights | ❌ Not available |
| Campaign Grouping | ✅ Organize codes by campaign | ❌ Cannot group codes |
| Analytics Dashboard | ✅ Charts and filters for trends | ❌ Limited or none |
| Export Reports | ✅ Downloadable reports (PDF/CSV) | ❌ Limited or none |
A/B testing is another feature to look for. It allows you to test different QR code designs, placements, and calls-to-action to see what works best. Additionally, tools with Google Analytics integration let you compare QR code traffic to other channels, giving you a full picture of your marketing performance.
How Pageloot Simplifies QR Code Tracking

If you’re looking for an all-in-one solution, Pageloot has you covered. Since 2019, over 20,000 U.S. brands have trusted Pageloot for its seamless tracking, user-friendly dashboards, and robust features.
The platform’s dashboard makes it easy to spot trends with clear visualizations like charts and filters. Users consistently rate it highly, with an overall score of 4.6 out of 5 and a 4.8/5 rating for ease of use.
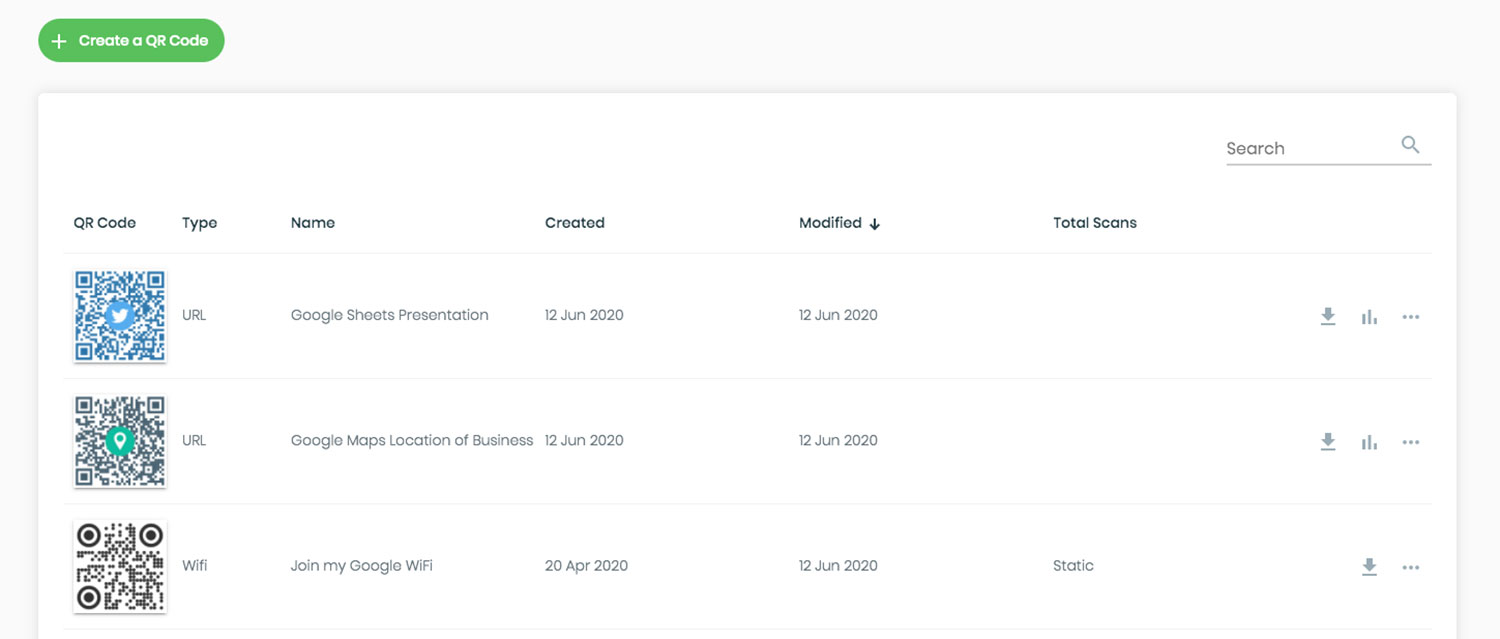
Pageloot supports 25+ QR code types, from basic links to more complex integrations like app stores, business locations, and social media profiles. This means you can track performance across a variety of campaigns without juggling multiple tools.
For businesses running multiple campaigns, Pageloot’s organization tools – like folders and tags – keep everything neat and campaign-specific. Plus, its retargeting features allow you to re-engage users who’ve scanned your QR codes, maximizing the value of each interaction.
Need high-quality printing? Pageloot offers vector file formats (EPS, PDF, SVG) so your QR codes look sharp at any size.
"Easy to use and quick. It works great and creates perfect images, so employees can download my vCard."
– Emma Moretti
Step 3: Define and Measure Core Metrics

Once you’ve set up tracking tools, the next step is to zero in on the metrics that matter most. These key numbers will tell you how well your QR code campaigns are performing. To get a complete picture, you’ll need a mix of hard data and insights into user behavior.
Quantitative Metrics: Scan Rates and Conversion Data
When it comes to QR code analytics, numbers are your foundation. These metrics give you a clear idea of how your campaigns are doing and where your investment is going.
Scan rate is where it all begins. This metric measures the percentage of people who scan your QR code after seeing it. If your scan rate is low, it might mean your QR code isn’t visible enough, the placement is off, or your call-to-action isn’t grabbing attention.
But scan rates alone don’t paint the full picture. Conversion rate is what really matters – it tells you how many users take action after scanning, whether that’s signing up, making a purchase, or downloading something. It’s also helpful to look at total scans versus unique scans. Total scans show overall activity, while unique scans reveal how many distinct individuals interacted with your QR code. For example, if you have 1,000 total scans but only 200 unique scans, it might mean people are scanning multiple times – this could signal a strong interest or potential confusion.
Another important number is cost per conversion, which shows how much you’re spending to get a desired outcome. For instance, if your campaign costs $500 and results in 50 conversions, your cost per conversion is $10. Comparing this to other marketing channels can help you see how QR codes fit into your overall strategy. Additionally, tracking session sources can tell you which QR code placements are driving the most valuable traffic to your site.
To put these metrics into perspective, the average landing page conversion rate is 2.35%, while top-performing sites achieve 5.31% or higher. The very best hit 11.45% and above. These benchmarks can help you assess how your QR code campaigns stack up.
Case studies highlight what’s possible when you track the right metrics. For example, Flipkart used QR codes in their Big Billion Days campaign to monitor scan-through rates. By tweaking their designs mid-campaign based on the data, they boosted their scan-through rate by 15% and achieved over 2 million scans.
Similarly, HSBC UK partnered with Shelter to promote bank accounts for the homeless using QR codes. Their tracking revealed a 52% increase in accounts within the first two weeks, with one in five scanners becoming regular donors.
These numbers give you a solid starting point, but understanding user behavior is just as important.
Qualitative Metrics: User Engagement and Behavior
While quantitative data shows what happened, qualitative insights help you understand why. These metrics focus on user engagement and behavior, giving you a clearer picture of what’s working and what needs adjustment.
Post-scan dwell time measures how long users stay on your landing page after scanning. If users leave quickly, it could mean your content doesn’t match their expectations or your page is too slow to load. Bounce rate is another key metric – it tracks the percentage of users who scan your QR code but leave without taking any action. High bounce rates often indicate a disconnect between your QR code’s promise and what users find on your landing page.
Secondary actions can also tell you a lot. These include clicks to other pages, shares, or further exploration of your site. Such actions signal genuine interest beyond the initial scan.
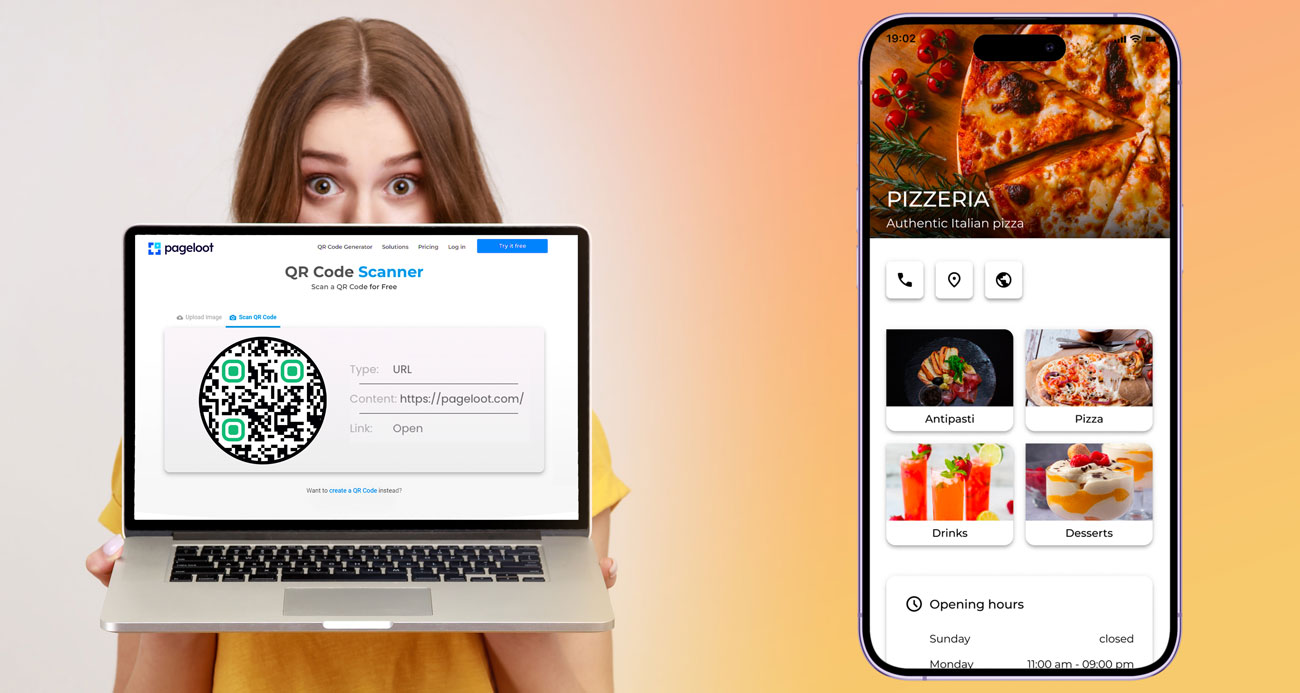
To dig deeper, you can use heat mapping tools alongside QR code analytics. These tools show how users interact with your webpage after scanning. For example, a restaurant could use dynamic QR codes and heat maps to see which menu items get the most attention. Similarly, a clothing retailer could track which products receive the most clicks or how far users scroll through their site.
A real-world example comes from Tourism New Brunswick, which used QR codes on direct mail flyers and TV ads to drive users to contest entry pages. Their analysis showed a 1.77% engagement rate from direct mail, with 209 users landing on their main page. Impressively, 80% of those users continued to the contest page, showing strong alignment between their content and user expectations.
"The location tracking offered by Uniqode is huge. We can see where people scan from, and we can use that data to better target our direct mail campaigns in the future." – Katie Dyson, Marketing Manager, DRMG
The real magic happens when you combine quantitative and qualitative data. For instance, high scan rates paired with low engagement might mean your QR code placement is effective, but your landing page needs improvement. On the other hand, low scan rates with high engagement suggest your content is strong, but your QR code visibility or design could use a boost.
To refine your campaigns, consider A/B testing different QR code variations. Experiment with calls-to-action, colors, sizes, and placements to find what drives the best results. By fine-tuning both your scan rates and post-scan engagement, you can make your campaigns more effective.
sbb-itb-74874c9
Step 4: Analyze Geographic and Time-Based Data
Now it’s time to dive into the details of when and where your QR codes are being scanned. By combining geographic and time-based data with your core metrics, you can fine-tune your approach and make smarter decisions. This kind of analysis lays the groundwork for adjusting your campaigns to better connect with your audience.
Use Geographic Data to Fine-Tune Your Targeting
Location data from QR code scans can reveal user behavior patterns that are crucial for tailoring your campaigns. For instance, research shows that 84% of people are more likely to scan offers that feel relevant to them.
Here’s how businesses have used these insights:
- A restaurant noticed high scan activity in office-heavy areas and created lunchtime promotions specifically for those zones, leading to a noticeable boost in sales.
- A skincare company tracked QR scans on their packaging and identified high engagement in humid regions. They responded by launching products focused on moisture retention in those areas.
Even industries like healthcare can benefit. Providers can track where their promotional QR codes are scanned to better target specific regions or demographics. To make the most of geographic data, consider placing QR codes in high-traffic areas and tailoring your messaging to fit the preferences of local audiences.
Use Time Data to Spot Engagement Trends
Timing is just as important as location. Time-based data gives you a clearer picture of when your audience is most engaged. This kind of insight can pinpoint peak scanning periods, helping you schedule campaigns for maximum impact.
For example:
- A clothing retailer found that 60% of QR code scans for exclusive discounts happened on weekends. They responded by introducing weekend-only flash sales, which significantly boosted revenue.
- A café noticed a drop in scans after 8 PM and launched a late-night happy hour to attract more customers during slower hours.
- A real estate agency added QR codes to property displays, allowing potential buyers to access information after hours. By tracking scan times, they adjusted their display strategies and saw an increase in property viewings.
If your data shows a high volume of scans during lunch hours, that’s your cue to launch key campaigns during that timeframe. Timing campaigns around these patterns ensures you’re meeting your audience when they’re most engaged.
"You need insights to know how your links are actually performing." – Pageloot
Combining time and location data can uncover even deeper trends. For example, scans might spike in business districts on weekday mornings but shift to residential areas on weekends. Platforms like Pageloot offer real-time analytics to help you monitor and act on these insights effectively. By understanding these patterns, you can create campaigns that feel tailored to your audience’s habits and needs.
Step 5: Optimize Campaigns With Data-Driven Adjustments
Now that you’ve analyzed geographic and time-based data, it’s time to fine-tune your campaigns. Use insights from your QR code analytics to make targeted improvements that can elevate your campaign’s performance. These changes should align with the user behavior and engagement patterns you’ve already identified.
Fine-Tune Landing Pages and Content
QR code analytics can reveal how users interact after scanning, offering valuable clues for improving their landing page experience. Take the example of M+, a museum in Hong Kong, which used dynamic, multilingual QR codes in 2024. They tracked 148,000 scans and engaged 113,000 visitors across 42 QR codes, identifying and addressing obstacles in the visitor journey.
Small tweaks can make a big difference. For instance, A/B testing elements like headlines, calls-to-action (CTAs), and page design can lead to significant results. Reducing form fields from 11 to 4, for example, can increase conversions by 120%, while adding testimonials can boost conversion rates by 15%.
Pay close attention to bounce rates to identify mismatches between user expectations and your landing page content. Tools like Google Analytics, combined with QR code data, can help you map user journeys and uncover areas for improvement. Keep in mind that user behavior varies depending on the source – scans from email campaigns may differ from those originating from print ads. Ensure your messaging and design remain consistent throughout the user journey.
Similarly, the physical placement of your QR codes plays a key role in campaign success.
Refine Physical QR Code Placement
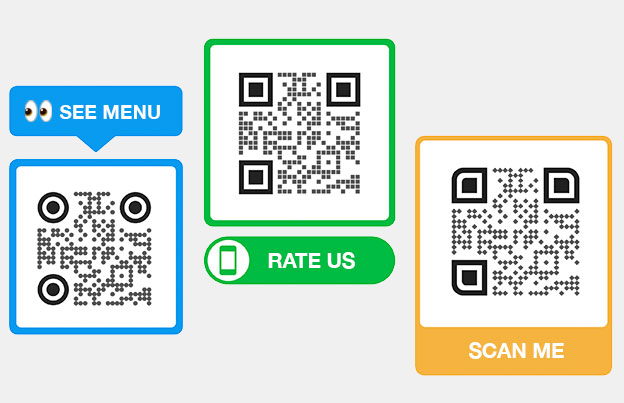
Your scan data can guide you toward the most effective placements. A strong placement strategy includes positioning QR codes in the upper half of marketing materials, steering clear of clutter, and using directional cues like arrows or text to draw attention. Research shows that 95% of consumers know how to scan QR codes, and half are likely to scan one when it’s part of a relevant and engaging ad.
Size matters, too. For TV ads, aim for QR codes around 300×300 pixels, ensuring they’re visible from 6–10 feet away. As a general rule, make your QR code about 1/8th of the total design size. Use high-resolution SVG file formats to keep your codes sharp and scannable across all displays.
Design also plays a role. High contrast and clear separation from other design elements improve scannability. For connected TV (CTV) ads, placing QR codes in the lower third or right-hand side of the screen helps avoid distractions.
A compelling CTA is essential. Highlight the benefits of scanning the code, and test different variations to find what resonates with your audience. Here’s a quick reference for best practices:
| Optimization Factor | Best Practice | Impact on Performance |
|---|---|---|
| Placement Position | First half of material; avoid clutter | Higher visibility and scan rates |
| Size Ratio | 1/8th of total design size | Improved scannability |
| Color Contrast | High contrast with background | Better recognition |
Run A/B tests to evaluate placement, CTAs, and design. Ensure QR codes are easy to scan, and that internet connectivity doesn’t create barriers . Double-check that the materials your codes are printed on don’t compromise their appearance or readability. Test across different devices and conditions to ensure reliability. Use your analytics to guide future placement decisions – if certain locations consistently underperform, adjust their positioning or design to drive better engagement.
"Strategic placement of QR codes enhances their effectiveness… Proper placement improves user experience and ensures that the codes are scanned without hassle." – Mayra Shaikh, Blogger and Creative Designer
Conclusion: Key Takeaways for QR Code Analytics
Tracking QR code performance isn’t just a one-and-done task – it’s an ongoing effort that can reshape your marketing outcomes. The five steps outlined earlier provide a solid framework to help you understand how your audience interacts with your campaigns and pinpoint areas for improvement.
By sticking to these steps, you’re not just monitoring performance – you’re fine-tuning your campaigns with precision.
The Importance of Continuous Performance Analysis
Consistent tracking is what separates guessing from knowing. Did you know that over 45% of QR code campaigns fail to deliver measurable ROI because businesses lack proper tracking systems? On top of that, 62% of marketers struggle to connect their offline efforts with digital results.
This disconnect presents a huge opportunity. When you track performance consistently, you gain real-time insights into how your audience is engaging with your campaigns. These insights allow you to make data-driven decisions that can significantly improve your outcomes.
Take Flipkart’s Big Billion Days campaign, for example. They actively monitored their campaign’s performance and, after spotting ways to improve, updated their creative designs mid-campaign. The result? A 15% increase in their scan-to-visit rate. This is a perfect example of how continuous optimization can deliver real results.
Dynamic QR codes add even more value by offering campaign flexibility and detailed tracking capabilities. Pair this with A/B testing, and you’ve got a recipe for ongoing improvement.
How Pageloot Can Support Your QR Code Strategy
To make these improvements easier and more effective, you need the right tools. That’s where Pageloot comes in. Trusted by over 20,000 brands, Pageloot simplifies everything we’ve discussed, offering a user-friendly way to implement all five steps of QR code analytics.
Pageloot’s platform includes real-time analytics, dynamic QR code updates, and organizational tools that make tracking campaigns straightforward. Forget juggling multiple tools – Pageloot gives you a clear, consolidated view of your campaign performance.
Its organizational features, like folders and tags, help you manage multiple campaigns efficiently. For agencies, white-label options ensure client branding stays consistent.
Reliability is key when tracking critical campaigns, and Pageloot delivers. With data centers in the US and EU and live support, you can trust your codes will work when your customers need them. Plus, the platform supports over 25 QR code types and provides vector file formats for high-quality printing.
"The most easy and reliable QR code Generator ever. PDF files can be uploaded instantly. Our restaurant menus are now digital."
- Hugo Laurent, Restaurant owner.
Pageloot even lets you start for free with static QR codes, followed by a 14-day trial for advanced tracking and analytics. This way, you can explore its full potential before committing to a paid plan.
With the right tools, the five-step process becomes far more manageable. Pageloot’s 4.6/5 average rating speaks volumes about its ability to make QR code analytics both accessible and actionable for businesses ready to move beyond guesswork.
FAQs
What makes dynamic QR codes more effective and adaptable for marketing campaigns than static QR codes?
Dynamic QR codes bring a level of flexibility and efficiency to marketing campaigns that static QR codes simply can’t match. While static codes lock in their information at the time of creation, dynamic QR codes let you update the destination URL or content anytime – without the hassle of reprinting. This means you can tweak your campaigns on the fly, responding to performance data as it comes in.
But that’s not all. Dynamic QR codes also come with advanced tracking features. You can gather insights like scan rates, user engagement levels, and even geographic data. These analytics give you the tools to fine-tune your marketing efforts and aim for better outcomes. It’s a smart way to keep your campaigns adaptable and data-driven.
What metrics should I track to measure the success of my QR code marketing campaign?
To evaluate the effectiveness of your QR code marketing efforts, keep an eye on these important metrics:
- Total scans: This shows how many times your QR code has been scanned, offering a big-picture view of its overall reach.
- Unique scans: Tracks the number of individual users scanning the code, giving you a sense of your audience size.
- Scan location: Pinpoints where the scans are happening geographically, helping you tailor location-based strategies.
- Device type: Identifies the devices being used, like smartphones or tablets, so you can fine-tune the user experience.
- Time of scans: Reveals when scans are happening, helping you spot peak engagement periods for smarter scheduling.
- User engagement: Measures what users do after scanning – like visiting your website, signing up, or making a purchase – showing how well your QR code drives actions.
Digging into these metrics helps you adjust your approach, connect with your audience more effectively, and make smarter choices for your future campaigns.
How can businesses use location and timing data to improve the effectiveness of their QR code campaigns?
Businesses can tap into location data from QR code scans to pinpoint areas with the most engagement. Placing QR codes in bustling spots – like shopping malls, events, or popular hangouts – boosts visibility and encourages interaction. On top of that, learning about the traits of users in these areas helps businesses craft messages and promotions that resonate with local audiences.
Timing data offers another layer of insight. By studying when QR codes are scanned the most, businesses can time their campaigns for maximum impact. For instance, a coffee shop might notice a surge in scans during morning hours and use that information to highlight breakfast deals. Combining location and timing data gives businesses the tools to make smarter, data-driven marketing decisions.


